1 Data Science: More Than a Technical Discipline
TL;DR: , do your homework
readings (links) & lectures ~ assignments due ~ live session agenda
Hi everyone! My name is Brooks Ambrose and I’ll be your instructor for W201 or, as we call it, RDADA (rah-dah-dah). I’m excited to finally meet you at our first live session, which will certainly be all about introductions, but we’ll also jump into the rhythm of the course right away.
At least by the start of every week I’ll post instructions for what to expect and where to focus your attention. I run my sections like a workshop, and my goal is that every week you will practice marketing yourself by honing your data science image and messaging. We’ll look at what that means from three main angles—decision making, research design, and conveying findings—but a big piece will always be your presentation of self. For Week 1 I want you to start thinking about how you situate yourself vis-à-vis other data science professionals in general and also your own “clients” in particular. This week’s lectures and readings will expose you to a lot of chatter, and your job will be to practice sending a clear signal of your own through the noise.
The best way to do that is to put pen to paper, or for this week’s activity, to put your face to video. I have two tasks for you to complete in preparation for our first live session.
- Complete onboarding.
- Record a 30-60 second video introducing yourself and who you want to help with data science.
Every week there will be assignments like these in addition to your readings and lectures. To help you plan your week and prioritize your responsibilities, I will share estimates of how long I think the week’s async will take you.
Please be aware that sections 3, 4, and 5 will diverge considerably from the assignment schedule described on the original course syllabus. The workload will be comparable.
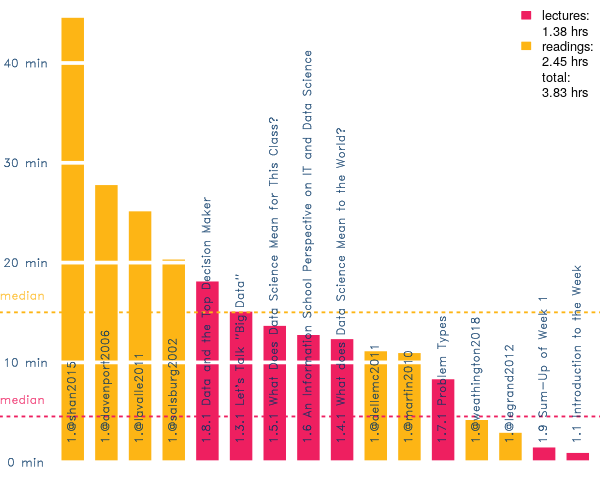
Figure 7: Week 1 “reading” time estimated at 250 words per minute
I recommend tackling the shorter readings first while taking a strategic approach to the most time consuming ones. Try the advice from Sink or Skim? which has tips for how to skim effectively. You can just power through the short readings; longer ones require a mental map before going in. For instance, the Shan et al. (2015) sample only has three interviews, but the first one with DJ Patil is much longer than the others. Prioritize where you want to focus, and write down at least one little take away from each reading. The goal is not to get through but to get something out of the readings.
Readings
- ↓ Davenport (2006)
- ↓ EMC (2011)
- ↓ LaValle et al. (2011)
- ↓ Le Grand and Cooper (2012)
- ↓ Martin (2010)
- ↓ Salsburg (2002)
- ↓ Shan et al. (2015)
- ↓ Weathington (2018)
Lectures
- ↓ 1.1 Introduction to the Week
- ↓ 1.3.1 Let’s Talk “Big Data”
- ↓ 1.4.1 What does Data Science Mean to the World?
- ↓ 1.5.1 What Does Data Science Mean for This Class?
- ↓ 1.6 An Information School Perspective on IT and Data Science
- ↓ 1.7.1 Problem Types
- ↓ 1.8.1 Data and the Top Decision Maker
- ↓ 1.9 Sum-Up of Week 1
1.1 Introduction to the Week ↑
| Players | Slug | Excerpt |
|---|---|---|
| δ ι | do something different | The point is to get people to do something different, whether that be really small tactical day to day things, whether it be really major strategic decisions, all the way to the very big identity issues about the kinds of people we are, the kinds of organizations we work in, and the kind of societies we live in. |
1.3.1 Let’s Talk “Big Data” ↑
| Players | Slug | Excerpt |
|---|---|---|
| γ α | sexism at Uber | a rampant culture of sexism at a company called Uber |
| ε υ | hands on crisis | now it’s got on its hands a cultural and public relations crisis |
| φ π | measuring sexism | So how would a company like Uber, or more importantly how would you if you were working at a company like Uber, start to think about measuring sexism? |
| τ ο | big enough to bother | a problem like this that’s actually big enough to bother solving engages with politics, with ethics, with money, with egos, and with human emotion |
| τ σ | ivory tower | Data science is being used in a situation like this in not just an ivory tower set of research experiments. |
| σ λ | right questions | at least to start, asking the right questions is at least as important as getting to the right answers. |
| ρ τ | bd2ds | it’s probably a good thing that the term of art of a few years ago, the word to use, “big data” is morphing into data science. |
| λ ψ | innovation and hype | it’s happening across a number of different domains unevenly, and as we look across those domains what we see is a mix of profound innovation, and extraordinary hype |
| ζ χ | teed up decisions | What decisions are actually being teed up by the data products or the data innovations |
1.3.2 ↑
| Players | Slug | Excerpt |
|---|---|---|
| τ ε | what people see | We’re going to look examples from the print and from the press to see what do people see as big data and what do people see as data science. |
1.3.4 ↑
| Players | Slug | Excerpt |
|---|---|---|
| π θ | shipping truck | I had my whole genome sequenced. And this is a sort of the exescale big data challenge. This generated a 5 terabyte file that my doctors and clinics had to send back and forth to each other through a shipping truck because you can’t have that much data over the internet. And it took 6 months for them to figure out how to analyze this. One of the big problems was there wasn’t enough computing power and networking power to even just handle that much data and compare my genome to the thousands of other genomes to figure out what’s going on with me individually. |
| μ ψ | misunderstood cancer | The good news is they persevered and did that and came back and told me, mmm we’ve misunderstood your cancer for 23 years, put me on a chemotherapy for another cancer and another drug I’d never been on. 3 months later cancer free ready for a kidney transplant. |
| λ η | N=1 health care | Well the topic I talked about today what I call care customization or N=1 health care, it’s healthcare designed for a sample size of one, you, as a complex adaptive individual who changes day to day, week to week, month the month and your treatments may need to change with you as your biology and behavior and whole cultural context change. Yeah I think where we’re headed with this sort of vision of personal health as a model where you go in for your annual physical with your GP or your doctor, and we’re looking at a computational model of you as an individual, and based on what’s happened to you over the last year, based on data that’s coming from your smartphone, based on your genomic data, which one may update and see what’s going on to see if things are being expressed differently in your body now than they were the last time we visited. |
| κ ν | Google earth of your body | Looking forward from that as like a map like a Google earth of your body and saying hmm there may be a problem here, here, or here, let’s do preventive care and predictive care and get on the front of those so they never become painful, they never become expensive, and that’s the future where we’re trying to head to |
| κ ξ | one percent of patients | I want to tap into some of those greater funds and figure out how to take what really less than one percent of patients on the planet have access to today and it mostly is in cancer but sort of scale it out to all conditions all diseases. What is personal health for diabetics going to look like, what is personal health for preventive care and primary care gonna look like, what is personal health for people with neurodegenerative diseases gonna look like. |
1.3.5 ↑
| Players | Slug | Excerpt |
|---|---|---|
| π ο | funny prez | Normally I’d begin these remarks with a joke about data science, but about half the stuff my staff came up with was below average. |
| χ β | almost anything | understanding and innovating with data has the potential to change the way we do almost anything for the better |
| ψ υ | data.gov | my administration’s opened up massive amounts of government data to the public for the first time. With more than 135,000 data sets available for download at data.gov. |
| γ σ | US Chief Data Scientist | We want more Americans to dream up and deploy innovations like these, to solve problems, save lives, and create new jobs and opportunities. That’s why I’m so pleased to welcome doctor DJ Patel as the federal government’s first (last?) chief data scientist. |
| γ ε | presidential | I’m asking you to help. As DJ likes to say, data science is a team sport. That’s why we want you, America’s data scientists to join us in this effort. Help us build better digital services for the American people. Help us unleash new innovation in areas like health care and climate change. Help us change this country, and this world for the better. Thanks. |
1.3.7 ↑
| Players | Slug | Excerpt |
|---|---|---|
| ψ ζ | tracking customers | Now security experts say that this is a matter of some concern. Customers don’t realize they’re being tracked when they’re going into a store, and they can’t access this data. The stores themselves say they’re just doing what online retailers have done for years. |
| κ σ | little green circles | You can see that as people are coming in there’s little green circles around them. Those little green circles are data points. RetailNext follows the path of a customer to restore some from the time that they enter the building and then what they do inside that store. Do they go left, do they go right, and when they go up to a fixture how long are they standing at that fixture. Are they going to actually make a purchase from that fixture. We’re kind of big data applied in a retail store environment. |
| η ζ | differentiate shoppers | Stores like Swatch and American Apparel have used this kind of software. The software can anonymously differentiate shoppers by gender, tell children from adults, and recognize repeat customers by wifi signals from their phones. |
| δ λ | Euclid Analytics | This specific chart is the visit duration, which tells us how long people are spending in our store. Philz coffee in California uses a platform called Euclid Analytics to track potential business as well as customer activity. It can tell us roughly how many customers are passing by our stores compared to how many customers are actually coming in. Additionally it tracks dwell time which tells you how long people are in the store for, and that becomes really helpful when you want to better understand the activity of your clientele and make tweaks to your operations and the design your store accordingly. |
1.3.11 ↑
| Players | Slug | Excerpt |
|---|---|---|
| υ ξ | 332 electoral votes | And we decided on the first day of the campaign to use data across departments because we thought it was the best avenue to the truth. And we ended up using data to inform almost every major decision we did in the campaign. And we had a singular goal to run a personalized campaign where you got a different campaign than you did all based on our ability to move you and persuade you to vote and support Barak Obama. And there’s 332 electoral votes that shows it worked. |
| δ υ | unfair advantage | in the aftermath of the election you hear people saying that it almost implying that the Obama campaign’s use of data was almost like it was cheating. They were like it’s an unfair advantage. Hello you’re not supposed to use that kind of thing, let’s go back to just door to door. |
| ι μ | absolutely everything changed | Give us your perspective on what’s changed in politics in the standpoint of the usage of data. [JM] Absolutely everything. Like seriously if you think about 2008, the entire landscape it changed underneath us. So we had to reinvent the entire campaign. |
| ω π | holy grail | We ended up using all that data to change the way we dealt with voters because in the old days people were treated like numbers and I wanted to treat them like individual people and what we knew about them. So we use data to make huge datasets to build models of behavior and once we got models of behavior we could figure out what people are going to do. So we ranked every single voter in America, including everyone in this room, from 1 to 100 on whether or not they support Barack Obama, on whether or not you were going to vote, and the third kind of new thing that’s the most important holy grail, whether or not you have a chance of being a ticket splitter back and forth. |
| β δ | we had big data sets | because we had big data sets, the average poll is 800 sample, we did 10,000 per night samples that allowed us to every night for 14 months run 62,000 computer simulations of the election. And everything that came out of that is how I spent the billion dollars. So every single decision we made was based on the 62,000 sample every night and that was how we did television, that was how we moved the president around, you know data became the most important thing we did |
| δ ρ | in the old days | in the old days campaigns were smoke filled rooms with 3 or 4 people who were rhinos, who said I’ve won these campaigns forever and this is how we do it in in Montana. And we, you don’t get a guy named Barack Obama like to president, if you take the old rules. So we had to run new rules and we reinvented using data. |
1.3.13 ↑
| Players | Slug | Excerpt |
|---|---|---|
| υ ω | hype machine | Where do you actually see the profound innovation and where do you see the hype. Sometimes the line between them is actually a little bit vague and let’s be frank there is actually a hype machine out there. In some ways that benefits us as data scientists, it brings us resources and attention, and in other ways of course it hurts us by creating unrealistic expectations and you’re going to experience both of those things |
| μ ξ | panicky or complacent | I’d also like you to take a few minutes if you would too reflect on the intuitive ethical repercussions of some of what you’ve just seen. It’s very easy for people to get panicky, and almost every year there’s a new kind of nexus against which that panic reflects. This year in 2017 it happens to be the Chinese experiment with social credit systems and you’ll be reading a little bit more about that later on the course. It’s just as easy interestingly to put the panic aside and get complacent or a little bit jaded about ethical implications. |
| μ ρ | you or someone else | Of course the third option that people sometimes turn to is to kind of reject all that stuff and say look, as a data scientist my work is value neutral, and somebody else has to worry about the ethical consequences of what I do. You can make that argument. I would say yes, but Somebody has to take responsibility. Either it’s the people who understand data science, or it’s going to be somebody else. |
| π κ | deciding ethical dilemmas | think in particular about the decisions that these data examples are teeing up. In other words not just the findings or the possibility of findings per se, but the decisions that people will be empowered to make work, or that they may have to make, once they have these findings in hand. And so think about some examples that come to mind in which those kinds of decisions, arrayed against the data product, create some interesting ethical dilemmas. Silly example, if you knew that tall people make better leaders than short people, what would you suggest people do with that knowledge? |
1.4.1 What does Data Science Mean to the World? ↑
| Players | Slug | Excerpt |
|---|---|---|
| ο ξ | One month sabbatical | And imagine for the sake of discussion that you’ve just been given a one month sabbatical to use your new skills in the data world to come up with a new proposal for mitigating climate change. The question that I want you to think about for this segment is, how do you start that month? What are you going to do on the first day, the very first day. |
| τ φ | how to be effective in the world | There’s probably 10 other questions you could ask, and you can’t answer them all in the course of your month sabbatical. So the point really here is to reflect on how would you start constructing your own data science enterprise, from the very start to the very end, in order to be most effective in the world. Because ultimately that’s what you care about here. I think this kind of question overlaps with the sort of big, broad, abstracted desire to try to have a point of view and develop a point of view over the course of this semester on what data science actually does and what it can mean to the world. |
| λ ν | choosing better questions | how do we choose better questions? And in the context of that we should recognize, look we’re just getting started. We’re really so far away, all of us right now, from a truly data enabled society that it may be that choosing the right questions to answer is as powerful if not more powerful than getting the answers precisely right. |
| ω ψ | expectations fears hopes desires | A lot people have opinions on where we are and what that means, some informed some uninformed, and as we’ve said before those opinions are made up of expectations and fears, hopes, desires, but I think most importantly and interesting for now, not a little desire, important to recognize not a little desire, to look for magic bullets, for problems that have seemed unsolvable up until now. But that’s actually not what most of us are going to be in a position to be able to create. |
1.4.2 ↑
| Players | Slug | Excerpt |
|---|---|---|
| ο κ | Big Data Era | Welcome to the era of Big Data. For the sake of clarity, let’s recall what Big Data means. At the intersection of the Internet, digital recording technologies and a profusion of small-scale wireless sensors comes an exponential increase in stored data. We’re recording information of every kind: tweets, engine temperatures, Facebook photos, stock trades, grocery store purchases. These data points pile up, billions upon billions, trillions upon trillions, recording our lives and the life of the world we inhabit. They are very, very valuable to people with the ability to see patterns in, and extract insight from, the blizzard of information blowing out of the cloud. |
| ψ ω | controlled chaos | Ultimately, the promise of Big Data is the ability to understand (and control) a seemingly chaotic world on levels never before imagined. The dangers of Big Data stem from that very same promise. Its impact on society will be akin to the transformative effect of past technological revolutions. |
| ζ ε | steam engine of our time | Big Data may be the steam engine of our time. I believe there is something real and powerful happening in the Big Data revolution. It’s more than just a fad. It’s the next link in the long chain connecting culture and technology to human history. Now Big Data—seen and unseen—is hitting us in all corners of our lives, from the price of things to traffic patterns to who our social networks think we befriend. Through new fields like data science and network theory, Big Data will not only change the world we move through as individuals, it will change the world we imagine through science. Like it or not, Big Data will only get bigger (and bigger). |
| υ φ | unimaginably vast data | the world contains an unimaginably vast amount of digital information which is getting ever vaster ever more rapidly. This makes it possible to do many things that previously could not be done: spot business trends, prevent diseases, combat crime and so on. Managed well, the data can be used to unlock new sources of economic value, provide fresh insights into science and hold governments to account. |
| υ ν | big algorithms | Scientists and computer engineers have coined a new term for the phenomenon: “big data”.” … “The amount of digital information increases tenfold every five years. Moore’s law, which the computer industry now takes for granted, says that the processing power and storage capacity of computer chips double or their prices halve roughly every 18 months. The software programs are getting better too. Edward Felten, a computer scientist at Princeton University, reckons that the improvements in the algorithms driving computer applications have played as important a part as Moore’s law for decades.” |
| τ θ | data economies | “What we are seeing is the ability to have economies form around the data—and that to me is the big change at a societal and even macroeconomic level,” says Craig Mundie, head of research and strategy at Microsoft. Data are becoming the new raw material of business: an economic input almost on a par with capital and labour. “Every day I wake up and ask, ‘how can I flow data better, manage data better, analyze data better?” says Rollin Ford, the CIO of Wal-Mart.” |
| υ ξ | data dissipation | The flood of data from sensors, computers, research labs, cameras, phones and the like surpassed the capacity of storage technologies in 2007. Experiments at the Large Hadron Collider at CERN, Europe’s particle-physics laboratory near Geneva, generate 40 terabytes every second—orders of magnitude more than can be stored or analyzed. So scientists collect what they can and let the rest dissipate into the ether. |
| α ζ | structured or useless? | “Only 5% of the information that is created is “structured”, meaning it comes in a standard format of words or numbers that can be read by computers. The rest are things like photos and phone calls which are less easily retrievable and usable. But this is changing as content on the web is increasingly “tagged”, and facial-recognition and voice-recognition software can identify people and words in digital files. “It is a very sad thing that nowadays there is so little useless information,” quipped Oscar Wilde in 1894. He did not know the half of it.” |
| μ κ | data deluge | mankind created 150 exabytes (billion gigabytes) of data in 2005. This year, it will create 1,200 exabytes. Merely keeping up with this flood, and storing the bits that might be useful, is difficult enough. Analyzing it, to spot patterns and extract useful information, is harder still. Even so, the data deluge is already starting to transform business, government, science and everyday life. |
| ρ ζ | industry leaders | A few industries have led the way in their ability to gather and exploit data. Credit-card companies monitor every purchase and can identify fraudulent ones with a high degree of accuracy, using rules derived by crunching through billions of transactions. Stolen credit cards are more likely to be used to buy hard liquor than wine, for example, because it is easier to fence. Insurance firms are also good at combining clues to spot suspicious claims: fraudulent claims are more likely to be made on a Monday than a Tuesday, since policyholders who stage accidents tend to assemble friends as false witnesses over the weekend. By combining many such rules, it is possible to work out which cards are likeliest to have been stolen, and which claims are dodgy. |
| λ β | older industries | Older industries crunch data with just as much enthusiasm as new ones these days. Retailers, offline as well as online, are masters of data mining (or “business intelligence”, as it is now known). By analyzing “basket data”, supermarkets can tailor promotions to particular customers’ preferences. The oil industry uses supercomputers to trawl seismic data before drilling wells. |
| τ λ | bureaucratic technical ethical | There’s much further to go. Despite years of effort, law-enforcement and intelligence agencies’ databases are not, by and large, linked. In health care, the digitization of records would make it much easier to spot and monitor health trends and evaluate the effectiveness of different treatments. But large-scale efforts to computerize health records tend to run into bureaucratic, technical and ethical problems. |
| ψ ο | advertising | Online advertising is already far more accurately targeted than the offline sort, but there is scope for even greater personalization. Advertisers would then be willing to pay more, which would in turn mean that consumers prepared to opt into such things could be offered a richer and broader range of free online services. |
| ε φ | public domain | And governments are belatedly coming around to the idea of putting more information—such as crime figures, maps, details of government contracts or statistics about the performance of public services—into the public domain. People can then reuse this information in novel ways to build businesses and hold elected officials to account. Companies that grasp these new opportunities, or provide the tools for others to do so, will prosper. |
| τ γ | deluge of risks | the data deluge also poses risks. Examples abound of databases being stolen: disks full of social-security data go missing, laptops loaded with tax records are left in taxis, credit-card numbers are stolen from online retailers. The result is privacy breaches, identity theft and fraud. Privacy infringements are also possible even without such foul play: witness the periodic fusses when Facebook or Google unexpectedly change the privacy settings on their online social networks, causing members to reveal personal information unwittingly. A more sinister threat comes from Big Brotherishness of various kinds, particularly when governments compel companies to hand over personal information about their customers. |
| ο ζ | out of control | Rather than owning and controlling their own personal data, people very often find that they have lost control of it. The best way to deal with these drawbacks of the data deluge is, paradoxically, to make more data available in the right way, by requiring greater transparency in several areas. First, users should be given greater access to and control over the information held about them, including whom it is shared with. Google allows users to see what information it holds about them, and lets them delete their search histories or modify the targeting of advertising, for example. Second, organizations should be required to disclose details of security breaches, as is already the case in some parts of the world, to encourage bosses to take information security more seriously. Third, organizations should be subject to an annual security audit, with the resulting grade made public (though details of any problems exposed would not be). |
1.5.1 What Does Data Science Mean for This Class? ↑
| Players | Slug | Excerpt |
|---|---|---|
| π α | technical skills | Technical skills in data sites today are really quite demanding and they’re gonna become more demanding. And excellence in those technical skills has to be the foundation of any data science program and it’s the foundation of ours. We’ve also designed those kinds of inputs in those kinds of courses so that the knowledge that you gain will be ready for constant updating, because this is a field in constant motion. |
| ε ι | necessary not sufficient | all these technical skills are necessary but actually are not going to be sufficient. In fact probably aren’t really even sufficient today for an effective data scientist. |
| υ η | risk findings | how do you take the information that you find when you run a query or run an analysis, and how do you convey that to others? Because that we think is one of the key strategic values we offer as well. It’s not just finding that finding but actually how do you convey to other people or convey that finding to others and persuade them to take an action, maybe something that’s risky. |
| ν λ | company center | our vision is that data science is not simply acting in the service of requests from others or directives from others. That may be the case in many companies today. But we see data science as moving right into the center of the company, right into the center of the organization. First as strategist, then into the c-suite and ultimately, and probably not very far in the future, to the position of the chief executive officer. And when we say that we mean not just the chief executive officer of a data science company, or of the kinds of companies that we think of as being data native, digitally born, comfortable with the idea that data ought to inform all decisions. |
| ε η | own the farm | In our view, today mostly data science is being used by other decision makers in that setting, but it won’t be long before the data scientists own the farm. |
1.5.2 ↑
| Players | Slug | Excerpt |
|---|---|---|
| α η | NFL Next Gen Stats | In the 2017 Super Bowl if you were following the NFL over the course of that season, one of the things that was really different about it was that in that game every player had a sensor in his shoulder pad that tracked movement, speed, and direction. And that data is available, at least parts of it are available if you go to Next Gen Stats on NFL.com. |
| θ α | film room | how useful has that data actually been? What actually in the football world you would think, it would really be valuable to know, say for example, who is running the fastest, who can cover the most ground on defense? But not so much if you’re actually in the football world itself. In fact what teams do depends on what are, reflected by themselves, acknowledged to be very subjective decisions. And as you know they’re made by coaches and those coaches are people who tend to watch videos in the film room. And they call it the film room, they don’t call it the data room. |
| γ κ | You Can’t Always Get What You Want | Patricia said he never actually uses the data, he doesn’t even want to see it. And it’s a fair question to ask, why not? I mean every single Monday in 2015 to 2016 he was given a report on what would seem to be really useful information. He got the speed of his players, the consistency of their running routes, he could even get the separation between a wide receiver and the defender, and again you can see some of the stats, but interestingly he didn’t seem to care. What he wanted was data he didn’t get. |
| ζ λ | You Get What You Need | He no longer was allowed to get data on the brute force of hits on the helmet because of the controversy over concussions in the NFL. And so Patricia was not getting what he wanted, and he was getting what he didn’t want. He said he was interested in other things, which were much much harder for those centers to quantify, like, what kind of a block has that lineman just used. Is the receiver using his head or his body to fake out the defender. Or a critical strategic question which he really wanted to answer like, is the quarterback getting rid of the ball quickly because that quarterback has really fantastic vision and a really fast receivers who are getting open, or is he getting rid of the ball so quickly because he’s just scared to death of taking a sack. |
| η τ | unaffordable mistakes | The NFL is spending a ton of money, time, people, resources, political capital getting beautiful data and creating beautiful data visualizations and some wonderful heat maps on the football field, but it’s actually not changing the game. In the proposition here is maybe the NFL can afford to make those mistakes. But in most of the organizations that you’re going to be working in and an organization that I work in, UC Berkeley, we can’t actually afford to make those kinds of mistakes. We have to get the questions right up front. |
1.5.3 ↑
| Players | Slug | Excerpt |
|---|---|---|
| ζ ω | brilliant and pedestrian | make sure that you become the brilliant data scientist who changes the world for the better not the brilliant that data scientist who nobody listens to. And let’s acknowledge that sometimes in some of our work on the brilliant data science to change the world for better can feel like you’re involved in what might seem like a slightly pedestrian project. |
| ψ γ | password resets | you discovered that if the system were to prompt people earlier in the shift for their password you could get a 22 or 23 percent reduction in password resets. Now that may not seem like a terrific scientific breakthrough, but actually it could make a real difference in healthcare economics. |
| θ μ | standard research design | do the students in this program need to come in and have a traditional 15 week class on sort of standard research design methodology the way you would teach it in a PhD program for example in the social sciences. And we decided that actually that’s probably not what we needed to do. We needed to do some elements of that, and course a lot of research design questions get picked up in statistics courses, the way we think about selecting on the dependent variable, or explaining why we do that, selection bias, too few equations too many variables, don’t over fit, many those things can be covered in other classes, statistics, experiments, machine learning. |
| σ χ | applied and efficient | our question really for this class is, how to design a research project that matters in an applied sense and in an efficient sense. |
| γ τ | optimized mix | imagine us trying to construct together almost an optimization problem bringing together a point of view on the resources we can bring to the table, the capabilities that we’re going to have in place, our ability to leverage action or decisions in the world against the importance of a question, and creating optimized sort of mix of all those ingredients so that we can ask better questions and find ways to answer them in a useful way that will change what somebody else does in the world in a way that makes things better. |
| π κ | compare across domains | I think it’s really important for us and actually some big part of the fun of the course is for us to be able to move across different domains. So some of them you’ll be interested in, some of them you might not. We’re gonna talk about medicine, sports, we’re going to talk about manufacturing, we’re going to talk about government, retail, security, and I hope that you’ll bring in more of those kinds of domain examples during synchronous sessions because after all comparing applications across domains can sometimes yield some really interesting findings. |
| β ν | simplify exaggerate complexify | when we talk about models in the social science world, as compared to the technical world, sometimes people get uncomfortable with what they see as bizarre or noxious oversimplifications. Well I’m gonna defend that now and we’ll come back to later by simply saying we treat models almost exactly the same way scientists and technical people treat models. We’re looking for the variables that we think really matter the most and we try to simplify them. Then we try to exaggerate them in the model so that you can see how they impact upon dependent variables or outcomes of concern. And then once we kind of get that picture in our heads of what’s happening, we slowly add the complexity back in an organized way so that we can improve the richness of the model. In other words we’re going to simplify, exaggerate, and then try to add the complexity back. |
| ζ φ | stretch and relevance | I think of it as a kind of trade off between stretch and relevance. When we’re focused on decision making, and as many of us experience in our day to day jobs, people are asking us, what’s the take away? How do we make this immediately relevant to the problem that’s on the table today? And we often find that in research positions there’s kind of an immediate trade off between that immediate relevance and stretch that means sometimes asking people to ask slightly different questions or to look beyond the problem of today to up frame it into a larger problem which actually might be more significant, but which we might not be able to solve right away. So we’re gonna try that kind of manage that trade off between stretch and relevance and just at least be aware and mindful of where we are on that dimension at any given time. |
| τ δ | common thought experiment | what if this precious assumption that we’ve held on to is wrong? Just completely wrong? That’s the most common kind of thought experiment. |
| ω π | uncommon thought experiment | what if this precious assumption is even more right than anyone thinks it is? |
| χ β | revolutionary fun | we want to make sure we’re having fun because I really believe the work we’re doing and the overall educational experience in a program like this, some revolutionary stuff and I am of the conviction that if we’re not having fun along the way we’re probably not doing it right. |
1.5.4 ↑
| Players | Slug | Excerpt |
|---|---|---|
| ψ χ | data exhaust | when I’m talking about data exhaust I’m not talking about the stuff coming out of the tailpipe of these cars or, actually in one case there is no tailpipe so there’s nothing coming out. I’m talking about the potential for sensorizing in a really profound way all three of the very different vehicles that you see on the slide. |
| κ ψ | heavily sensorized | Apart from the performance of the car, in other words apart from what people would call telemetry, if you had a passenger in each one of those three vehicles, pick one that you like the best, and it was heavily sensorized, what other questions would you try to ask from the data exhaust that you have access to coming out of that vehicle. What’s the most important question you would like to ask? |
1.6 An Information School Perspective on IT and Data Science ↑
| Players | Slug | Excerpt |
|---|---|---|
| β ω | Silicon Valley | I started to understand that the really remarkable pace of innovation and change in the valley didn’t have to do with the technical skills of the people there. There are people all over the world that had technical skills and have technical skills. They have capital. They have universities, great universities, science parks, all the things that we think goes into innovation. But what happened in Silicon Valley was a set of social structures that allowed information to move very quickly between firms and people to learn very quickly about organizational change, about technology, about business models, and whatnot. I realize that the social and organizational aspects of the region where ass important as the technical skills of the individuals or the capital markets or the universities. |
| ω γ | school of information | Most academic disciplines are narrowly focused. I have a degree in political science, there are computer science programs, there are math programs, economics programs. And what I’d seen in Silicon Valley led me to think that we needed to educate people who could work across those domains. People understood the social world, understood management some, and understood the technology and how technology was evolving. And that’s really what the school of information has tried to do over the past couple of decades. And I think data scientist is simply the latest and newest, and I think one of the biggest things that we are going to be able to engage as a school of information. |
| β σ | open boundaries | I think the thing that I love about it is that those, in the previous eras universities have been very localized. I mean to some extent there were ivory towers, but in the best cases in Silicon Valley they opened up their boundaries a bit. This opens up our boundaries much more widely. Now we can reach students anywhere in the world, and we can educate students to work in Africa or in Asia, anywhere in the US. So this is a huge opportunity, and I think we’re going to see the spread of data science accelerating because of the online technology. |
| ε κ | quick diffusion | I’ve seen successive waves of technology. And one of the indicators of something that is going to be big is that it diffuses very quickly out of one particular sector across domains, and we’ve seen that happen very quickly in data science. It started in social media companies, in technology companies, especially technology companies, but very quickly we’re seeing it being picked up. First of all finance has been doing it, but then it’s been picked up in advertising and marketing, and you’re seeing now that it’s being picked up and health care and just a wide range of domains. |
| ξ τ | slower diffusion | And I think there are many more that it will be picked up in, remain, are slower because for organizational or institutional reasons. You can think about education or about government, which badly need this I think analysis of their data to help improve their processes but will take awhile for people to start to really move into those sectors and overcome some of the barriers that exist. |
| τ β | accelerated waves | I think each wave builds on the previous wave, so the speed of the web allows the next wave to be faster. The PC wasn’t as fast as the web, the web now enables the data science to be even faster, and in between that you got the mobile device. So these things the sensor networks, all of these technologies are building on one another. So I think each one is faster it’s accelerated. |
| β σ | context front and center | I think we really wanted to make sure that our students had an understanding of the relevant technical skills, they need to understand algorithms and machine learning, they need to understand statistics, and and they need to understand databases, but they also needed to understand the context in which those would be applied. So they needed to understand a domain but also how to ask a good question of data. How to think about how to decisions will be made with data. What are the broader policy contexts that will shape how data is being used. I think we’re increasingly aware of the issues about privacy and those issues are front and center. The issues of context, of decision making, of communication, and of policy are front and center of this program alongside the harder skills of programming and statistics. And what I learned from Silicon Valley is that that mix is very powerful in organizations. |
| υ χ | tech outpaces institutions | technology has always outpaced our social arrangements, our institutions, our law, and we hope that we can start to build those things in from the beginning. |
| π τ | where’s the work | My hope is that graduates will be found in any organization from your nonprofit to the public sector, to international organizations, to banking, healthcare. I think any organization that has data will want to be working with it, trying to understand, see what it can help them learn about their own organization and how they might provide services better, or define new products, or make decisions better based on their data. |
| λ ε | data naive companies | I think the data native companies are sort of at the leading edge of all of these techniques of developing the new algorithms, and I think that some of our students may well move into those places. But I think the places where there’s the most growth, the most potential growth in the future, is all of the other companies in the economy and organizations that don’t natively know how to integrate it and are not really even organized to do it. Their data maybe in one part of the organization, the engineers maybe somewhere else, the decision maker somewhere else. They may not know how to make use of their data so I’m thinking that our students will actually help transform these old line companies to move them into the world of data intensive strategy. |
| ο ζ | New World | presumably that requires all the data technical skills, but also a kind of strategic mindset that’s able to sort of use those skills not even in the service of solving particular data problems but in the service of actually transforming the organization to be data friendly. [AS] Absolutely. I mean I think it is an even bigger challenge in a way, it’s a more multi faceted challenge about thinking about how organizations are going to evolve in this New World. |
| υ φ | backlash and pitfalls | I think the first thing actually is to be a role model for the broader social, sort of more well rounded data scientist who understands context and decisions and whatnot. I think getting involved in the broader conversation, about the use of data, about how data can contribute to good decision making, but also to understanding the potential pitfalls. I think there’s a lot of potential for a backlash against data and data scientists if it’s misused. And so I think at the same time that we want our graduates to be role models we want them to be understanding those ethical dilemmas and models of how to address the broader societal and organizational issues as well as their own domain and organizational issues. |
| ε σ | building trust | I think almost at any level starting really from the firm in the community level, informing their colleagues, starting the conversation in a direction that understands the potential and understanding how to think about the pitfalls and avoid them. I think it could be writing op-ed pieces, it could be joining local organizations, it could go all the way up to up the FTC, but I think right now mobilizing at a very grassroots level is actually quite important. There’s a lot of anxiety. I think about my parents and what they read about data and it sounds scary. They’re collecting all this data about us. So I think we need to help them understand that there’s real value that can be gained from the data, but also that to understand that the people who are working with this data, are considered and have thought and will continue to think about the issues that they worry about. |
| ν ρ | keep up or fall behind | we’ve seen already, I mean in the short life of this field, of a lot of evolution, a lot of new tools are coming out, new new databases, new storage mechanisms. So I think our students are gonna have to assume that they will be continuing to learn as they go along and I think that means participating in the broader community, professional communities, where education happens. Hopefully they’ll stay in touch with one another and they will have an alumni community that can help. But I think at every level this is moving very quickly and anybody who doesn’t stay on top of those skills will probably fall behind so. |
| μ ρ | global impact | I think with data science we’re gonna make a global impact. We’re gonna make an impact beyond just the San Francisco Bay Area, and I really would like to see students who have this mix of skills that will allow them to be more effective ambassadors of data science and of Berkeley more broadly. |
1.7.1 Problem Types ↑
| Players | Slug | Excerpt |
|---|---|---|
| π η | Donald Rumsfeld | I want to start this segment by reminding everyone of a famous speech that former Secretary of Defense Donald Rumsfeld gave, famously, around 2003 I think it was, in which he talked about a phrase that now everybody knows, the “known knowns”, the “known unknowns”, and the “unknown unknowns”. And he was given a lot of, shall we say feedback, around that speech much of which was very critical. At the same point that distinction got a lot of attention, and it’s a good one, it’s actually really important. |
| ζ δ | depth of meaning | Because I’m going to submit for the moment that most of the work that we’re gonna be doing is in the area of the known unknowns. The typology that we’re gonna talk about is actually more about depth of meaning. And interestingly I think it provides more freedom of action. So we’re going to introduce a simple typology of data science problems that appear in the world and we’re going to call them type 1, type 2, and type 3 problems. And it’s kind of a conceptual scheme that we’re gonna use or experiment with using to sort through problems and match with the right level of thinking about solutions. |
| ι β | wicked problems | a phrase “wicked problems”, which many you probably heard and that actually goes back to 1973. It was created by environmental scientists to describe complex socio-technical systems where problems have no definitive formulation. And the literature on wicked problems basically adds up to a statement that the formulation of the problem is itself the problem. And many of us have to deal with wicked problem, many of us want to deal with wicked problems because in some respects they’re the most interesting ones in the world. |
1.7.2 ↑
| Players | Slug | Excerpt |
|---|---|---|
| ε χ | literary theory 123 | there’s a really good schema we can borrow from people who analyze English literature texts, funnily enough. They have a really simple way of thinking about at their level 1 questions, where the answer is found directly in the text that we’re dealing with. There are level 2 questions where the answer is inferred from the text. You can infer it from what’s there but it’s not directly there. Then their level 3 questions which go beyond the text and are actually about abstract concepts that are embedded in the text. |
| ε α | read Moby Dick | Everybody has read Moby Dick. If you haven’t read Moby Dick, go read it. |
| ζ ω | Moby Dick 123 | level one is very simple in the text. What color is the whale? The whale is white. Simple. The level 2 question. What what’s going on, what’s Ahab’s real problem? What is captain Ahab so obsessed with? Why is he so worried about the whale? That’s what the book is really about and the meaning can be inferred from the text. But it’s the level 3 question that is really interesting, and the one that calls upon people to work hard. Level 3 question might be, what’s the nature of obsession as a human trait? How prevalent is obsession? How many people are obsessed? How much of history is explained by obsession? What else does obsession do? |
| κ β | Organizations 123 | Type 1 questions are questions where typically both the question that’s being asked and the answer are gonna be relatively clear. You might not have all the information you need, you might have to look for more data, but what you’re asking and once you’ve got the answer how to explain it to people. Type 2 question is often when the question might be clear, but the answer’s gonna be unclear and a little bit abstract. And no matter how much data you have, no matter how much information is on the plate, it’s not necessarily going to be possible to create a really crisp clear answer. And then there at the 3rd level questions where both the answer and the question are both unclear and abstract. |
| ε α | Supermarket 123 | Let’s say I work for a supermarket. A typical type 1 question, what should be the price of a pound of peaches in the supermarket today? And the answer really clear, it’s gonna be a number. And the question is clear, what’s the price of peaches? We’ll be able to figure that out if we have the right information. A type 2 question might be, so what’s our strategy for selling fruit in this super market? That can involve lots of different things like where we place the fruit, how much we charge, how we light it, how much we polish it, do we have organic and non organic. Lots of different answers could come to that question. Little bit unclear where we’re gonna go with that. But then there’s the type 3 question. Which is in some sense the most interesting and the most challenging. How about this. What are our customers actually doing when they buy fruit? What needs are they fulfilling? Maybe you’re just looking for something sweet, but maybe they’re looking to fulfill some hole in their hearts that was left when they were kids from not having enough sweets. |
| ω θ | History 123 | There was a time in the 1960s where the core of business strategy was really about figuring out type 1 problems. Helping a company to decide what’s the right price for a pound of peaches today. But by the 1970s 1980s that wasn’t really a differentiating feature for companies any more. What became the more interesting question for strategists was the sort of type 2 question. What’s our fruit strategy? And that’s a kind of a question that an enormous number of consultancies made lots and lots of money from over the years helping businesses figuring out what’s their fruit strategy. And they used information but fundamentally it wasn’t all about information. Today the really interesting questions that people are struggling with are the type 3 ones. What are people doing when they buy fruit? What does that mean to them? What value can we create around that? |
| τ γ | data science 123 | here’s our proposition for data scientists. If you look out at what data science is doing right now today, data science is making a huge impact on type 1 problems redefining what it means for example to price in real time. Data science is starting to make an impact on some interesting type 2 problems and obviously we want to grow all that. But the most ambitious objective, the thing that we’re really shooting for in this course is to bring data science to bear on the type 3 problems. To help people inside your business or your organization figure out not just what the pricing strategy is and not just with the fruit strategy is, but to really understand the deeper meaning imbedded in fruit for the customers that you’re serving. And when we can bring data to bear on that then we’re making a huge impact on corporate strategy. |
1.7.3 ↑
| Players | Slug | Excerpt |
|---|---|---|
| ε τ | Warriors 1 | I’m confronted with what is the data product I’m gonna create to try to actually keep the Golden State Warriors here. And I’m using this type 1, type 2, type 3 distinction so I’m gonna think about it this way. Really good type 1 problem, what’s the pricing algorithm for tickets? Maybe we can actually get the ticket pricing sort of more optimized against demand for particular games, or particular adversaries, or whoever’s playing that day. That would be an interesting type 1 problem a great project to do. |
| π λ | Warriors 2 | But there’s also a type 2 problem that I can offer. So type 2 problem might be, what do our fans like and not like about the experience when they come to the game? And that would involve not just of course the price of the tickets but all sorts of things that happened as they were in the Coliseum, maybe involving their experience getting to the Coliseum, parking BART, etcetera etcetera. |
| ι ξ | Warriors 3 | But look here’s the really interesting. If the type 3 question. Where does loyalty to the Warriors really lie? What does the Warriors’s presence at the Oakland Coliseum mean to the city of Oakland? How much should the city of Oakland spend or invest to try to keep the Warriors here? How important is that to the way people think about themselves in their identity as citizens of a city? |
1.8.1 Data and the Top Decision Maker ↑
| Players | Slug | Excerpt |
|---|---|---|
| η ω | my friend Michael | an old friend of mine who has spent most of his life trying to influence the decisions of top leaders, CEOs, and the like, and he’s done that mainly in the realm of type 3 problems. The reason I chose Michael for this interview is because I think he has a particularly human perspective on how data scientists can most effectively work with decision makers who are not data scientists. In other words communicating between sophisticated data and people who just aren’t trained in that world. He has a I think really interesting point of view on how to manage uncertainty, how to communicate information, how to deal with issues around confidence in decision making, and again to do that across the data non data divide. |
1.8.2 ↑
| Players | Slug | Excerpt |
|---|---|---|
| ο ω | people’s minds | I’d like you to think about really where these perspectives are coming from, what do they represent in people’s minds and why people are holding them, how they might change as the technology changes, as data scientists move out into the world in leaps and bounds and move into broader sets of organizations, and as the capabilities change. |
1.8.3 ↑
| Players | Slug | Excerpt |
|---|---|---|
| σ ρ | 3 big tasks | CEOs do in fact occupy a position that’s really different from people in other places in the organization. Their tasks really typically divides into 3 big ones. They spend time managing and coaching people who do much of the operational and routine activities. They spend a great deal of time communicating what the organization is doing and why it’s important. And finally perhaps 20 30 percent of their time they work on really difficult questions of strategy and the next decade for the company. So what this means for the data scientist I think is really quite profound. The data scientist in effect needs to earn a place at that table in order to be really effective. In turn that means that it’s not simply bringing new data to bear on a given issue or question. It’s also being able to explain what the implications are of those data and why they matter in the first place. |
| ξ ο | CEO attention span | You’re right about the CEOs’ attention span and by the way you can count on one fact which is that it will be interrupted even as we speak. The most important thing to bear in mind is that an insight from new data or from patterns that emerge has to be salient or relevant to the larger concerns of the organization and therefore of the CEO in order to be noticed and taken seriously. The corollary of that which hardly needs saying but here is is that technical problems and techniques for their own sake are not particularly of interest. So not doing a shazam or bringing some fun facts to bear is probably a good idea. It has to be relevant. |
| ν λ | embarassing shazam | [SW] And we’ve talked sometimes about how the shazam can sometimes be almost a little bit embarrassing in that situation. Can you say a little bit more about that? [MD] Yes it can be because it decreases the credibility of the people involved if they are dwelling too much on details that are not addressing the major questions on the table. [SW] One of the things I think you probably never want to do is make the CEO feel inadequate or stupid right. [MD] I’ve done that and it was a disaster. |
| λ β | salient or accurate | 80 percent salient is more important than 100 percent accurate |
| ν μ | probabilities or likelihoods | The most important contribution that the new data science can make, in addition to pointing out implications of what the data are saying, is to deal I think realistically what the probabilities or the likelihoods that one thing may happen as opposed to another, one course of action may be more successful than another, one thing is more attractive than another to either the stakeholders of the customers or both. And so in order to understand that degree of relevance you need to have spent a lot of your attention thinking about probability, likelihood, and as you put it salience. The accuracy as such is almost never in question. It’s so much better than it was 20 years ago. The data is not really the issue. But as always it’s the pertinence of the data and the implications for action that make all the difference. |
| ζ τ | confidence | [SW] What about overconfidence and underconfidence as it relates to the underlying data. At what point do you think about introducing that into the conversation and differently as you sort of move up the ranks of seniority inside the organization? [MD] One way to think about this would be to say if my result is such and such and I’m advocating a certain course of action or insight based on that data, what would happen if I cut it in half? If the result would not change the action that would be plausible or advisable under the circumstances that degree of accuracy is not relevant to the issue under consideration. It may be relevant to the data and the data scientific angle of the question, but it is not strictly speaking something that the CEO will care about. |
| τ ρ | certainty drive | How do you deal with that innate drive to get more certainty out of the situation than you can possibly get? [MD] You don’t lie about what you know. In other words if your knowledge and your insight are limited to a specific level, or a specific area, or a specific segment let’s say of the customer base then say it as such. And allow the natural decision processes with all their uncertainties to rise to the surface. Because that’s real life. Data are very important, but data are not everything for a CEO. |
| ζ μ | CEO 1 | If you think about the known knowns, that is problems or situations that are already known to exist and the question is what to do about them. This is actually probably the bread and butter if you like of data science in corporate or organizational settings. And what what this would involve would be of course monitoring or validating the ongoing data stream, establishing what the norms are in a certain set of permissible deviations and operations and so on. This is almost never the realm of the CEOs attention. [SW] Interesting. [MD] The reason is that they have subordinates who take care of a lot of the operational details and whose accountability and responsibility it is to assure the integrity of that kind of activity. So maybe 80 percent or something like that of data science will be at that level. |
| ι υ | CEO 2 | Now if you move on to the known unknowns, that is, categories of uncertainty that you’ve already recognized such as, let’s say, a competitor’s behavior. You can’t predict a competitor’s behavior with absolute certainty, but you have an idea of where they will go given a certain set of industry conditions. You have some set of questions about whether people will, let’s say buy a new product. But you know what the fundamentals are of the growth of disposable income, the population and so on. So in these areas what you’re searching for I think creatively as a data scientist would be patterns of fact the implications of which would be important to the running of the business or change in direction of the business. |
| ι ο | CEO 3 | In the third case where the CEOs real responsibilities ultimately lie, these are the unknown unknowns. And we moved from the realm of even relative certainty here about the world and what it might evolve into, into a new set of territories. |
| ι δ | narrative and numbers | you started off as a historian and historians tend to be people who really understand and are comfortable with narrative. And later you moved into a consulting environment where you spent a lot of time working with numbers. And there probably is some instances where bringing those two elements together in a really powerful way gives you something that was a whole lot more than just the sum of 1 and 2. |
| τ θ | reams of paper with lots of numbers | the motivation of the CEOs was in all segments of the industry the same. Persist and let brand power do the work. Our team didn’t believe it and we did not want to encourage the CEO to make a mistake. In those days the numbers mattered and it was of course nothing like the data dashboard era of today. So when we presented the numbers it was a big deal and had to be reams of paper with a lot of numbers on them and that was meant to convince people. But in this case the right answer, which was to withdraw from the Japanese market, was not something that any of the senior management wanted to hear. So we had to tell the story in a way that gave the cultural context enough room to do its work. |
| σ ι | Pokhari Sweat | So, get on the plane, go back to the United States, have the final progress review with the CEO. Before the CEO entered the room we set up a table. Two tables in fact. One table had this can and another table had something like 200 cans that looked like this. That featured items like Pokhari Sweat. That introduced the Beer Shuttle. [SW] The Beer Shuttle, this is before the space shuttle! [MD] No here’s the space shuttle, it was the cap on top. These products were vended from vending machines on the streets of Tokyo and everyone else in Japan. Including whiskey. Imagine vending whiskey in 1985 in New York. Not likely. One table with this can, another table with several hundred cans like this. CEO walk in, looks, that was that. Progress review done. Story told. Withdraw from the Japanese market began the next week. Eventually the brand was sold to a more capable competitor and a lot of money was not lost. |
1.8.4 ↑
| Players | Slug | Excerpt |
|---|---|---|
| μ σ | Chile or Japan | How is the situation surrounding Pinochet and regime stability and in Chile going to unfold? Surrounding a particular event which was a plebiscite that Pinochet had called. A yes no up down vote on his tenure if you will. And a lot of complexity around that as to whether or not he would actually allow fair vote in that type of thing. But those types of questions about understanding the complexity of the actors involved in and having to think scenario planning or about different hypothesized outcomes. It’s still a little bit more containable than something like where is Japan going with respect to its grand strategy, which is something we were dealing with when I was working in East Asia in the mid 90s and there was a lot of drift in the US Japan alliance. |
| ρ χ | wrong question | I mean the ideal scenario is you can get in a room with them or you’re in a room with them and you can have an open conversation about those very things. Often times though it’s the old do the analysis and throw it over the transom model where it’s then curried and brought to decision makers. And they digest it and then you might get requirements back or you’re hit with the requirements and then you have to assess it. But I will say that what you try to do is make sure that even as you strive to answer the original question there are ways to actually broaden the question or deepen in the question in a more meaningful way and then play that back in your own assessment. |
| φ α | will the internet bring down China? | will the internet bring down the Chinese government. That was literally the question. And they asked us like what are we supposed to do that. And their response was, we’re just not going to answer this, which can get you in some deep trouble in the government when you choose not to respond a policymaker. I’m not even sure how that works because I’ve never done that myself. I advised them the way to do that is to, is there some, is to look at the question and ask yourself, is there is there something they’re actually getting at there that’s actually meaningful, that has some degrees of plausibility within it that I can then build upon and then reframe the question? Even if I don’t tell them I’m reframing it but I’m actually reframing the question that still gets a what they want to get at, but allows me to conduct an assessment with integrity in my own mind. It has analytic honesty and integrity because it’s a legitimate question. |
| θ α | the good and the crazy | the best decision makers that I’ve ever interacted with are the ones that actually want to get you in the room to see if they can hammer out what is the right question and bring you into that process. But a lot of times there’s still big wall there that you just sort of rely on the requirements to come down the chain and then the feedback to hopefully, hopefully you’ll get feedback based on your assessments. You don’t always get it and sometimes it’s crazy. |
1.9 Sum-Up of Week 1 ↑
| Players | Slug | Excerpt |
|---|---|---|
| ζ φ | RDADA | that’s again what we mean by research design and applications for data analysis. In other words if I had to sum it up in one sentence I would say getting it right and making it matter in exactly equal proportion. And so I think it might be interesting for you over the course of this week, this coming week, model that for yourself. As you run into interesting questions at work try to spend a little bit more time focusing on refining the question, and not jumping quite so quickly to, how am I going to get to the answer. |
| ζ δ | no pressure | I ask you for this week to just kind of experiment, play around with, thinking about data science project or data product as just that. A kind of very expensive, high stakes technical experiment in human decision making with massive stakes for your career, all of our careers, and for the world as a whole. |
Bibliography
Shan, Carl, William Chen, Henry Wang, and Max Song. 2015. The Data Science Handbook: Advice and Insights from 25 Amazing Data Scientists. Data Science Bookshelf, The. https://static1.squarespace.com/static/54bf3241e4b0f0d81bf7ff36/t/55430a6ee4b03b82c61468bf/1430456942860/the_data_science_handbook_three_free_sample_chapters.pdf.
Davenport, Thomas H. 2006. “Competing on Analytics.” Harvard Business Review, January. https://www.study.net/r_mat.asp?mat_id=50043065&Crs_ID=30124014&check=passed.
EMC, Dell. 2011. “Data Science Revealed: A Data-Driven Glimpse into a Burgeoning New Field.” https://www.emc.com/collateral/about/news/emc-data-science-study-wp.pdf.
LaValle, Steve, Eric Lesser, Rebecca Shockley, Michael S. Hopkins, and Nina Kruschwitz. 2011. “Big Data, Analytics and the Path from Insights to Value.” MIT Sloan Management Review. http://sloanreview.mit.edu/article/big-data-analytics-and-the-path-from-insights-to-value/.
Le Grand, Julian, and Zack Cooper. 2012. “The Geeks Must Quash the Believers in Gut Instinct.” Financial Times. https://www.ft.com/content/5a996db2-5c93-11e1-8f1f-00144feabdc0.
Martin, Roger. 2010. “Beyond the Numbers: Building Your Qualitative Intelligence.” http://eds.a.ebscohost.com/eds/detail/detail?vid=15&sid=3e68d0af-9eb7-4d19-90d7-736c0395dffb%40sessionmgr4006&bdata=JnNpdGU9ZWRzLWxpdmU%3d#AN=51011418&db=bth.
Salsburg, David. 2002. The Lady Tasting Tea: How Statistics Revolutionized Science in the Twentieth Century. New York, NY: Holt Paperbacks. https://www.study.net/r_mat.asp?mat_id=50222963&Crs_ID=30124014&check=passed.
Weathington, John. 2018. “Why Data Science Is a Secret Weapon for Tech Consultants.” TechRepublic. https://www.techrepublic.com/article/why-data-science-is-a-secret-weapon-for-tech-consultants/.