2 When Big Data Meets Big Decision
TL;DR: start a group project, initialize your individual portfolio
readings (links) & lectures ~ assignments due ~ live session agenda
This week you’ll learn about the history of business intelligence in the lectures and get some exposure to a few business applications in the readings. You’ll also start to learn a little about the history of MIDS in the week’s group project! Finally, you’ll initialize your individual portfolio and jot down a few starting ideas.
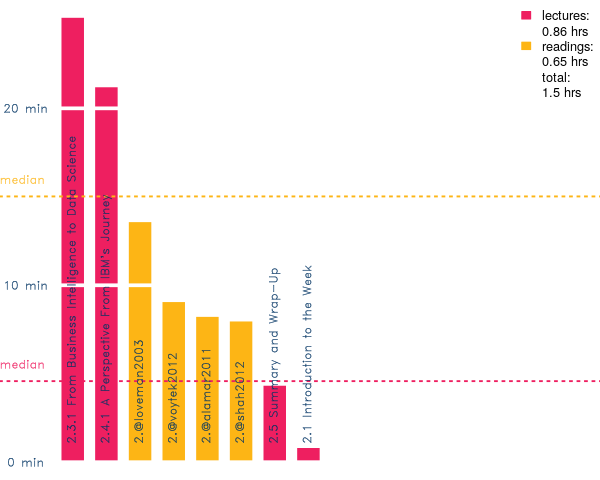
Figure 9: Week 2 “reading” time estimated at 250 words per minute
Readings
Alamar and Mehrotra (2011) ↑
| Players | Slug | Excerpt |
|---|---|---|
| θ κ | sports analytics defined | We define sports analytics as “the management of structured historical data, the application of predictive analytic models that utilize that data, and the use of information systems to inform decision makers and enable them to help their organizations in gaining a competitive advantage on the field of play.” |
| λ η | expansive and restrictive | Our definition is both expansive (in the sense that it includes not only statistical models but also the broader information value chain that surrounds these models) and restrictive (because it excludes traditional analytics applications such as demand forecasting, revenue management and financial modeling, all of which are certainly relevant in the business of professional sports). |
| ν θ | data management | Data management includes any and all processes associated with acquiring, verifying and storing data in an efficient manner. |
| η τ | missing incomplete inaccessible siloed | missing, incomplete and/or inaccessible data inherently reduces the value of any other investments in analytics. In many organizations, data is often stored in isolated silos, so that getting data is often not a smooth process. |
| σ φ | extensive performance data | the personnel group at one NFL team had been collecting extensive performance data on various groups of both opposing players and their own players. The coaching staff had no idea that the data existed, but when they did discover it, they had difficulty accessing it. The data resided in spreadsheets on the computers of the personnel group instead of being integrated into a common data archive. |
| λ ε | predictive analysis | Predictive analysis, the next piece of the framework, is the process of applying statistical tools to data to gain insight into what is likely to happen in the future. In sports, this can involve the projection of the pro careers of amateur players, identifying how the strengths and weaknesses of an opponent will play out against your own team’s strengths and weaknesses, or assessing whether a free agent would fill a need on a team at an appropriate cost. |
| ω κ | intelligent information system | The results of these analyses may feed directly into an intelligent information system that provides decision-makers with standardized results. Alternately, such results may be reported directly to a decision-maker for special projects that may be outside of any standard systems. |
| τ γ | organized for meaningful insights | information systems typically allow for visualization and interactive analysis of relevant information from multiple sources in one place, organized in a meaningful way to provide insights for decision makers. For example, a cutting-edge sports information system might combine unstructured information from scouting reports, summary reports from multiple data sources and results from predictive models. |
| λ ζ | ultimate customers | Decision-makers are the ultimate customers for all components in the sports analytics framework. However, the modern professional sports organization typically has many different decision-makers, including the general manager, coaches, scouts, trainers, salary cap managers and other personnel executives. Decision-makers in different functional areas may utilize different data and models to tackle different types of questions. |
| υ τ | Moneyball | Michael Lewis’ seminal book, “Moneyball: The Art of Winning an Unfair Game,” about the Oakland A’s use of data and models had recently been published, and no one had yet thought seriously about the application of motion capture technology in the context of professional sports. Just six short years later, more than half of NBA teams now utilize the tools of analytics on the team side of the their operation, most MLB teams now consider analytics a normal part of baseball operations, and companies such as STATS LLC are installing cameras in NBA arenas and NFL stadiums to capture more and more data. |
| ξ γ | information knowledge understanding wisdom | The world of sports generates far, far more data today than could have been imagined just a few short years ago. Dean Oliver, director of Publication Analytics at ESPN, has spoken of finding “data that can win championships.” However, as the computer scientist Clifford Stoll has said, “Data is not information, information is not knowledge, knowledge is not understanding, understanding is not wisdom.” Too much time is still spent by analysts using their skills to try and answer questions that are not meaningful to decision-makers in pro sports. |
| ω σ | hands and minds | despite the remarkable growth in the amount and variety of data available of examination and analysis, the world of sports analytics still faces the same ubiquitous challenge: How to get meaningful information into the hands – and minds – of the people who are in a position to make effective use of it. |
Loveman (2003) ↑
| Players | Slug | Excerpt |
|---|---|---|
| ι χ | dazzled by service | the customer pulling Into Harrah’s Las Vegas is dazzled more by the service than the building. |
| ζ σ | make her feel special | Although the customer doesn’t fit the stereotypical profile of a Las Vegas high roller, Harrah’s makes sure she feels special. Because the casino delivers the recognition and service she has come to expect, she’ll return to Harrah’s again and again. |
| σ τ | mining casino wars | we’ve come out on top in the casino wars by mining our customer data deeply, running marketing experiments, and using the results to develop and implement finely-tuned marketing and service-delivery strategies that keep our customers coming back. |
| τ π | fantasyland Las Vegas | Satre’s vision differed markedly from the strategy pursued by other big casino operators, whose “If you build it, they will come” philosophy focused on attracting customers to a fantasyland Las Vegas. |
| υ ρ | novelty wanes | Satre believed that competing largely on the basis of billion-dollar facilities in the face of new competition was not the most prudent use of capital because the returns on such buildings often weaken when the novelty wanes. |
| λ κ | cultivating relationships | He also suspected that cultivating lasting relationships with the company’s core customers-slot players - would lead to greater and more sustainable profit growth. So he opted to invest in development of the intellectual and technological capabilities needed to assemble and analyze data about those customers. The goal was to provide good service to them and thus encourage their loyalty to the company’s brand. When Satre hired me as COO, he said he wanted to change Harrah’s from an operations-driven company that viewed each casino as a stand-alone business into a marketing-driven company that built customer loyalty to all Harrah’s properties. |
| γ φ | Total Gold | Launched in 1997, Total Gold was designed to provide regular customers with incentives to visit Harrah’s properties throughout the country. Customers inserted their Total Gold cards into slot machines and earned credits as they played. They were rewarded with the standard fare that all casinos offer-free hotel rooms, dinners, show tickets, gift certificates. But there were three problems with the program. |
| α β | digging our diamond mine | While Total Gold wasn’t much good for keeping customers loyal to Harrah’s, it was quietly digging our future diamond mine. By tracking millions of individual transactions, the information technology systems that underlie the program had assembled a vast amount of data on customer preferences. |
| ο ω | transactional data points | a 300-gigabyte transactional database that recorded customer activity at various points of sale-slot machines, restaurants, and other retail areas in our properties. Database managers fed that information into our enterprise data warehouse, which contained not only millions of transactional data points about customers (such as names, addresses, ages, genders) but also details about their gambling spending and preferences. |
| ξ ε | one statistic | When we started digging into the database, one statistic stood out: Our Total Gold cardholders told us in surveys and focus groups that they were spending only 36% of their annual gaming budgets at Harrah’s. This presented an opportunity. There was a promise of tremendous upside if we could induce customers to spend more of their gaming money at Harrah’s and if we could communicate effectively with them. |
| ω θ | let the data suggest | Common practice calls for defining marketing strategies apart from database strategies-that is, the company comes up with a grand marketing scheme and then tries to adjust the database to its strategies. Unlike many companies, we decided to let the data suggest the specific marketing ideas to us. The information we found in our database indicated that a loyalty strategy based on same-store sales growth would work. |
| υ λ | 26% generated 82% | Before we could persuade customers to come back time after time, however, we needed to take a hard look at them and understand how much value each of them brought to us. We discovered that 26% of the gamblers who visited Harrah’s generated 82% of our revenues. |
| χ ι | discretionary time | We were surprised to find out who our best customers really were. They emphatically were not the gold cuff-linked, limousine-riding high rollers we and our competitors had fawned over for many years. Instead, they turned out to be former teachers, doctors, bankers, and machinists-middle-aged and senior adults with discretionary time and income who enjoyed playing slot machines. |
| π η | quantitative models | we were able to develop quantitative models that allowed us to predict, based on an individual’s play, his or her “customer worth”–the theoretical amount we could expect the customer to spend not just during one evening but over the long term. Suddenly, we saw how we could differentiate our brand. Understanding the lifetime value of our customers would be critical to our marketing strategy. |
| δ β | player’s unique preferences | The best way to engage in this kind of data-driven marketing is to gather more and more specific information about customer preferences, run experiments and analyses on the new data, and determine ways of appealing to players’ interests. We realized that the information in our database, coupled with decision-science tools that enabled us to predict individual customers’ theoretical value to us, would allow us to create marketing interventions that profitably addressed players’ unique preferences. The more we appealed to these preferences, the more money the customers would spend with us. |
| δ η | radical idea | a radical idea: We would reward customers for spending in ways that added to their value. Most consumer businesses insist that they can’t treat one customer differently than they treat another, even though some customers are obviously worth much more than others. To us, that approach was fundamentally wrong, but it didn’t mean that we had to focus on the relatively small number of high rollers. Rather, we made a point of treating our millions of regular customers differently depending on their value to us. |
| θ υ | simply human nature | It turned out that our customers–I would venture to say all customers–actually enjoy aspiring to higher levels of achievement and reward. It’s simply human nature. Understanding this, we split our customers into three tiers: Gold, Platinum, and Diamond cardholders, based on their annual theoretical value. Platinum and Diamond cardholders receive greater levels of service, which adds an aspirational element to the program. |
| ω ξ | others’ perks | People who weren’t card-carrying Harrah’s members and Gold customers stood in lines at the reception desk or the restaurant. Platinum customers would stand in still shorter lines, and Diamond cardholders would rarely ever have to stand in line. This created a visible differentiation in customer service. It was essential for our customers to see the perks that others were getting. |
| θ λ | series of triggers | We also set up a series of triggers in the database and analyzed the customers’ responses to those triggers. If, for example, we discovered that a customer who spends $1,000 per month with us hadn’t visited us in three months, a letter or telephone call would invite him back. |
| χ γ | mix of machines | We discovered that at any given time, it was possible to know which specific customers were playing at particular slots in Harrah’s Las Vegas and what it was about that specific machine that appealed to them. This knowledge allowed us to configure the casino floor with a mix of slot machines that benefited both our customers and our company. |
| δ ζ | employee performance | Our data told us that our customers want friendly and helpful attention in addition to fast service. We decided to link employee rewards to customer satisfaction. Accordingly, we chose to measure all employee performance on the matrices of speed and friendliness. The better the experience the guest had, the more money employees stood to make. |
| δ γ | bonus program | We implemented a bonus plan to reward hourly workers with extra cash for achieving improved customer satisfaction scores, which we culled from very detailed customer surveys. If a property’s overall rating rose 3% or more, each employee could earn $75 to $200. What has made the bonus program work is that the reward depends on everyone’s performance. |
| χ κ | five in line | When he goes off duty, the Laughlin general manager tells employees to call him at home any time, day or night-whenever they see five people waiting in any line. To us, this is living proof that our same-store sales growth in tough markets has been driven by sustained attention to great customer service. |
Lectures
- ↓ 2.1 Introduction to the Week
- ↓ 2.3.1 From Business Intelligence to Data Science
- ↓ 2.4.1 A Perspective From IBM’s Journey
- ↓ 2.5 Summary and Wrap-Up
2.1 Introduction to the Week ↑
| Players | Slug | Excerpt |
|---|---|---|
| ξ δ | big strategic decisions | What is data science really going to change when it comes to organizations informing big strategic decisions that determine their future? |
2.3.1 From Business Intelligence to Data Science ↑
| Players | Slug | Excerpt |
|---|---|---|
| μ θ | how else would you do it? | What do we have to talk about here? Shouldn’t all decisions really be driven by data? Well how else would you do it? And for actually aspiring data scientist that’s a very natural way to think about the world. But let’s just remember that it is not a natural way for many others to think about the world. |
| ρ ξ | Donna Karen Mick Jagger | Consider your favorite adult fashion designer, the intuitive genius, Donna Karen or whoever. For them the notion that you would use data to define your decisions about what products to build might actually be incredibly counter intuitive or even counterproductive. Imagine talking to Mick Jagger the Rolling Stones and showing them a data set on what people kind music people like. It just wouldn’t make sense to people like that. |
| κ ε | big decision good data | The bigger the decision you have to make, the more important it is that we have and use good data to drive that decision. |
2.3.2 ↑
| Players | Slug | Excerpt |
|---|---|---|
| τ ζ | what big means | First of all, ask the question for a moment, what is a big decision? What does “big”" mean in that phrase? |
| π χ | president’s clothes | Who a major country elects as a president probably is a big decision. What color clothes the candidate wears during a televised debate probably generally not thought of as a big decision. But part of beauty of the discipline of data sites is that it’s very good it collapsing those apparent distinctions that appear different. |
| υ ξ | hard to tell big and little | In fact I think in retrospect when you sort of wipe away the value judgments it’s very hard to tell what is big and little. In most cases those phrases are really signals about our ignorance about correlations in causal inference. |
| κ λ | correlation or causation | it’s probably just correlation that yellow shirt and victory with some other more fundamental causation that we haven’t yet discovered. But maybe that also doesn’t matter very much. I mean if I can win the elections on a regular basis by making decisions X, whether that be some huge strategic statement or whether it be some small tactical decision about what kind of shirt I want someone to wear. It’s probably a big decision regardless of whether I know why I’m making it. |
| ο π | tactical or strategic? | that distinction between what’s tactical and what’s strategic is in the eyes of the person who has to make the decision. It’s not some big truth claim or epistemological claim about actual importance. It’s kind of a perceptual claim about what the person or organization making the decision thinks about that particular decision. |
| χ σ | eyes of the decider | in that person or that organization’s eyes at that moment, is this a tactical decision or is it a strategic decision? And that distinction is gonna matter to us because it matters to the decider. And it matters to do the decider because it’s gonna help to determine how that person views data and data science as input. |
2.3.3 ↑
| Players | Slug | Excerpt |
|---|---|---|
| φ χ | continuum | When thinking about these realities, aspirations, and possibilities, we like to think of them along a continuum from understanding, to deciding, to control. |
| κ χ | understand | we tracked data to be able to figure out, how long is my commute going to be today, how many miles is it to go to a place? In each of these instances we’re using some amount of data whether small or big to better known to understand things about ourselves, products, or the environment around us. |
| ζ φ | control | We also use data both small and big to control things and a lot of this is going into the future. Say controlling again things about ourselves our health or fitness. Imagine they maybe there’s a credit card that can’t be used for certain types of food. Or maybe you get something available say a reward after you meet a goal. Those things are controlling your behavior as well as your interactions. |
| φ ο | tornados | When thinking about the things we need to be really careful there isn’t necessarily a direct relationship between data in each one of these. Now we can understand tornadoes to some degree but we can’t really decide or control them |
| τ ψ | love or even cats | We can decide things without really understanding them or being able to control things, perhaps love or even cats |
| θ ε | control without understanding | we can control things without understanding them and that could be perhaps by design, a normal person say using a mobile phone which is incredibly complex or like I described earlier the automatic transmission. You can control the car but do you really understand how it works. But you can also control things perhaps like by ignorance, say depression through medication, you just don’t know about it. |
| σ χ | called to decide | In this course we’re primarily interested in understanding and using data to decide things and that’s purely pragmatic. We think that over the next decade data scientists like yourself are going to be called on to principally help organizations make better decisions. Now when you first go into an organization you’ll often need to use data to first understand things. And some decisions will be about enhancing control with data but the primary focus from day to day is using data to make decisions. |
| ν κ | incredibly risky | What we’re talking about is the really really big ones, the way we described as this once in a Blue Moon rare opportunities to make a significant strategic difference in an organization or a market or for an individual. They really cause disruptions and they change the future and oftentimes they’re incredibly risky. |
| τ γ | Peugeot | imagine you’re the automaker Peugeot who’s French and they’re thinking about entering the US market which is highly competitive. Do they go all hybrids? That’s a big decision for a company, let alone just entering the market. What kind of cars do they offer here? |
| ε φ | Southwest | imagine you are Southwest Airlines who right now southwest has a fleet of entirely Boeing 737 aircraft. Those aircraft are starting to age. It’s a strategic decision for them to keep those aircraft or perhaps go to a mixed fleet, using Boeing or Airbus |
| υ μ | Nike | imagine you’re Nike. You know a sports apparel, a retail company, do you go out and offer an electronic fitness device? Something similar to say maybe what FitBit is doing. It’s very different for a company like Nike. |
| ι γ | Microsoft | Microsoft which is based in Redmond Washington you know with employees around the world do you instead maybe now decide, you let employees work from home all the time. Perhaps that could be a competitive advantage for Microsoft. |
| ν θ | USA | US government here particularly now how does the US intervene overseas. Humanitarian efforts, military efforts those are big decisions that are facing organizations. |
| ω κ | United Health | imagine your United Health you know when you’re expanding say into a new region or a new state. Do you offer neighborhood medical clinics which or smaller or do you offer big central hospital. Which is more of a classic model that you have. It has ramifications for your organization. |
| π β | Yankees | the New York Yankees have been known for years for signing big long term contracts, Alex Rodriguez, Derek Jeter. What if you stop doing that? What would be the implications of that for an organization? Perhaps that’s something they’re going to do going forward. |
| ι β | Nokia | Nokia for years has been making mobile phones, mobile devices, telecommunications infrastructure. Well they now sold it. They sold their mobile device business. That changes Nokia’s outlook of what they’re going to do. |
| υ ξ | Chevron | imagine Chevron local company here the Berkeley campus. Currently based primarily in petroleum exploration and refining. What if they expanded their solar research, taking up what British petroleum who was doing a fair amount of solar research is no longer doing that, publicly announced they are no longer doing it. What if you’re Chevron? Can you capitalize on that opportunity and make a big difference? |
| φ η | Detroit | Imagine you’re a principal or a municipality thinking of say Detroit. What does the city and county or the area of Detroit do now? What is a big decision facing them? Do they redevelop certain areas? If so how do they do that or perhaps do they abandoned things? |
| η α | incredible responsibility and cats | For a given task and your own organization going forward we want you to think about where are you on that continuum? Often when starting out you’re going to be using data to understand things. And essentially through understanding things you can help make better decisions about it. And then through making better decisions about things you can better control those things. But remember some things are really uncontrollable. Like cats. But much of your work is going to be about decisions. These are really ultimately large big strategic decision. These are rare opportunities to change the future and it’s an incredible responsibility. |
2.3.4 ↑
| Players | Slug | Excerpt |
|---|---|---|
| η ι | what a boss wants | Did a boss ask you to help her “understand” something, when what she really wanted you to do was help her to make a decision? Did she ask for help in making a decision, when what she really wanted was your advice on how to assert control over something that she didn’t currently control? |
2.3.5 ↑
| Players | Slug | Excerpt |
|---|---|---|
| ρ α | profound ethical difference | there’s a kind of an obvious but I think profound ethical difference that begins to emerge among and between those 3 different categories. Let’s put on the table a starting point as kind of a null hypothesis. Did the ethical stakes go up and potentially get higher as you move along that continuum from understand, to decide, to control. |
| ρ ο | value neutral | it would really be nice if you had understanding projects, projects that were solely about understanding, that you could mark out and say these are value neutral. And it’s possible to embark on projects like that without having to worry too much about ethics. That would be nice. It would be nice if decisions were always less ethically charged that attempts to control. But I think you’ll find on quick reflection and discussion that these things, I mean they might be nice, but they’re actually very rarely going to be true. |
2.3.6 ↑
| Players | Slug | Excerpt |
|---|---|---|
| ι δ | incredible numbers | Imagine you’re a trader centuries ago in search of goods to buy and sell let’s say at your local market. You have an incredible numbers of decisions to make. |
| ι ω | Hans Luhn | this term business intelligence, it’s been around for about well over 50 years. Hans Luhn was a researcher at IBM back in the fifties who’s looking at how businesses can use technology. IBM had been around for years primarily in the business technology space. He came up with this concept of a business intelligence system and wrote an incredibly influential paper1 about it in 1958. |
| δ ρ | business | Business is a collection of activities carried on for whatever purpose be it science technology commerce industry law government and defense and others. Pretty broad definition of what business is. |
2.3.7 ↑
| Players | Slug | Excerpt |
|---|---|---|
| α η | NA | NA |
2.4.1 A Perspective From IBM’s Journey ↑
| Players | Slug | Excerpt |
|---|---|---|
| α υ | NA | NA |
2.4.2 ↑
| Players | Slug | Excerpt |
|---|---|---|
| β δ | NA | NA |
2.4.3 ↑
| Players | Slug | Excerpt |
|---|---|---|
| δ φ | NA | NA |
2.4.4 ↑
| Players | Slug | Excerpt |
|---|---|---|
| ο μ | NA | NA |
2.4.5 ↑
| Players | Slug | Excerpt |
|---|---|---|
| χ ζ | NA | NA |
Bibliography
Alamar, Benjamin, and Vijay Mehrotra. 2011. “Beyond ‘Moneyball’: Rapidly Evolving World of Sports Analytics, Part I.” Analytics Magazine. http://analytics-magazine.org/beyond-moneyball-the-rapidly-evolving-world-of-sports-analytics-part-i/.
Loveman, Gary. 2003. “Diamonds in the Data Mine.” Harvard Business Review 81 (5): 109–13. http://search.ebscohost.com/login.aspx?direct=true&db=bth&AN=9721850&site=eds-live.
Shah, Shvetank, Andrew Horne, and Jaime Capellá. 2012. “Good Data Won’t Guarantee Good Decisions.” Harvard Business Review. http://search.ebscohost.com/login.aspx?direct=true&db=bth&AN=73552652&site=eds-live.
Voytek, Bradley. 2012. “Automated Science, Deep Data and the Paradox of Information.” O’Reilly Radar. http://radar.oreilly.com/2012/03/data-science-deep-data-information-paradox.html.
Notice where decision-makers sit in Luhn’s diagram.↩